
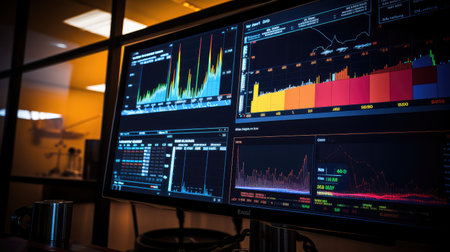
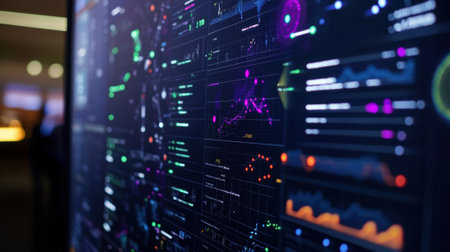
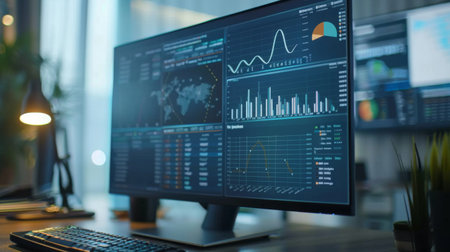
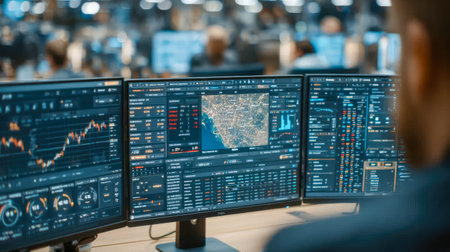
charts oil rig data
Коллекция по умолчанию
Коллекция по умолчанию
Создать новую
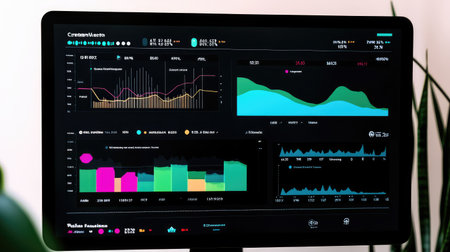
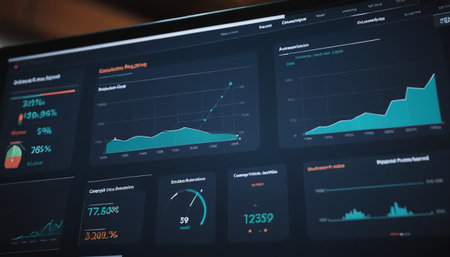
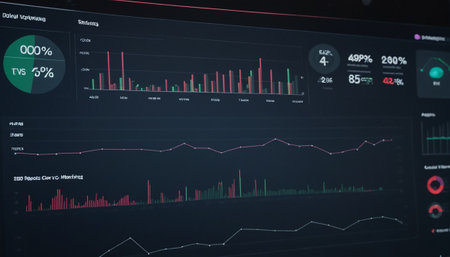
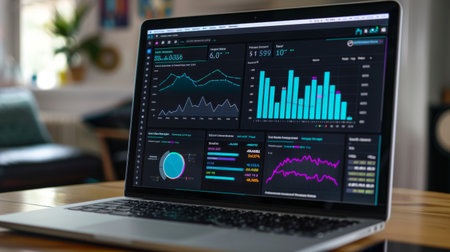
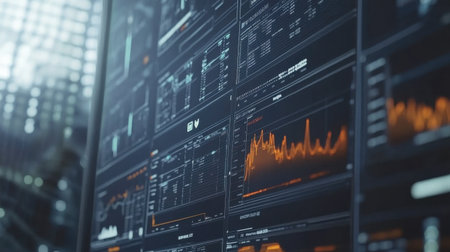
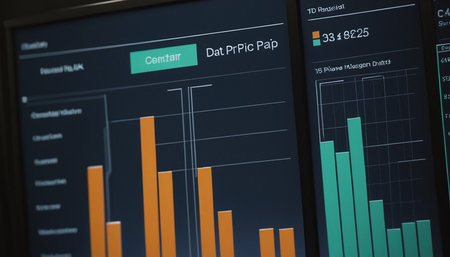
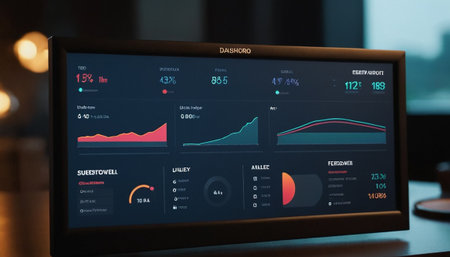
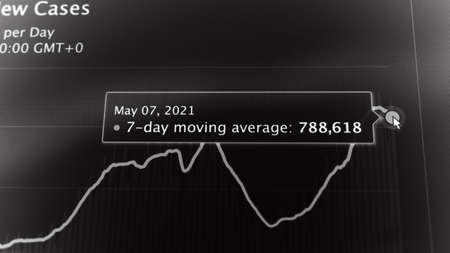
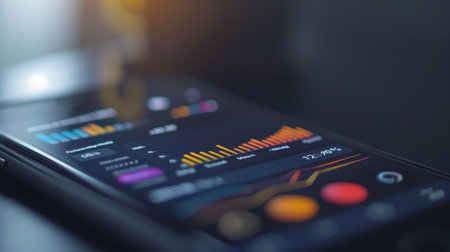
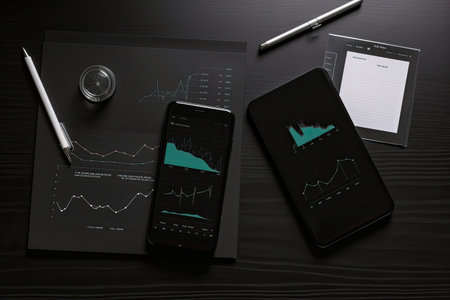
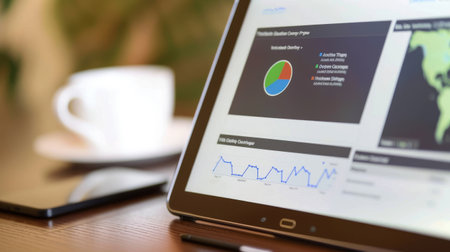
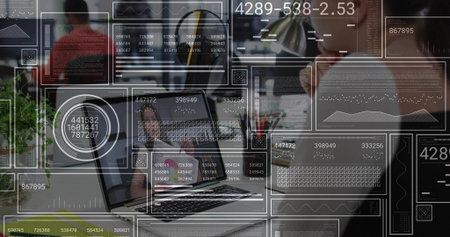
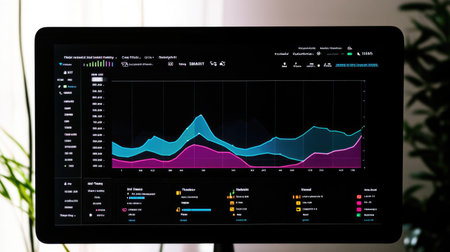
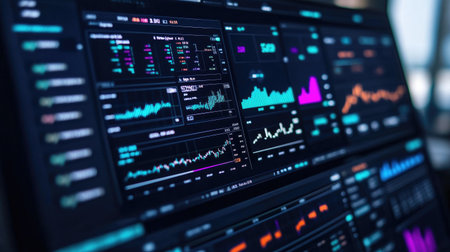
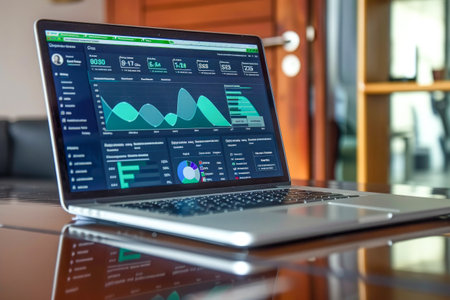
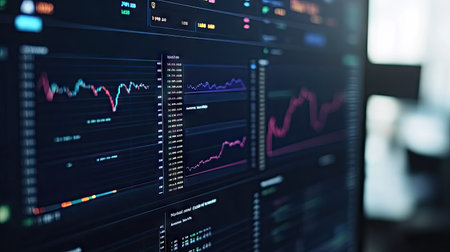
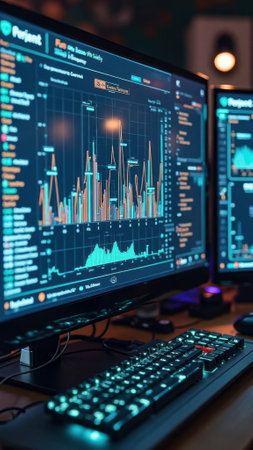
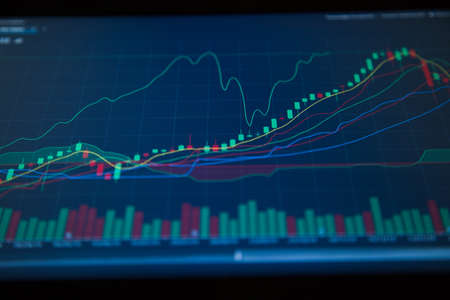
A close-up of a financial dashboard with growth charts and profit reports, providing space to add insights on economic growth, investment strategies, or market expansion
Коллекция по умолчанию
Коллекция по умолчанию
Создать новую
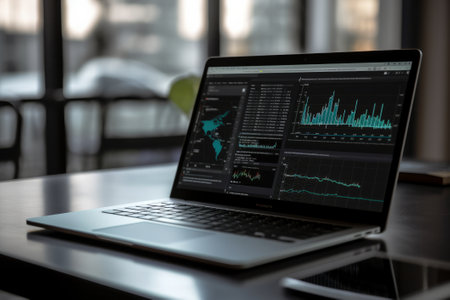
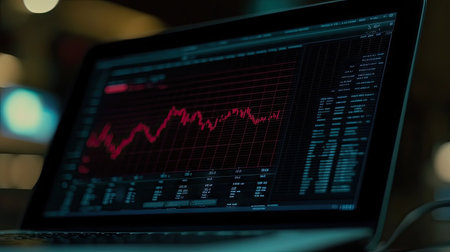
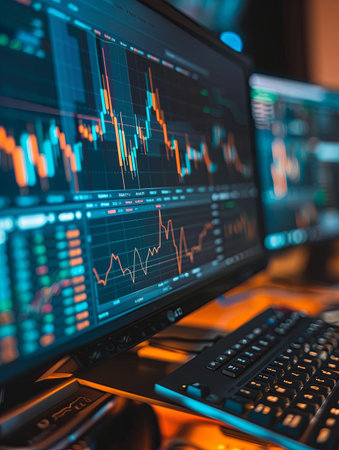
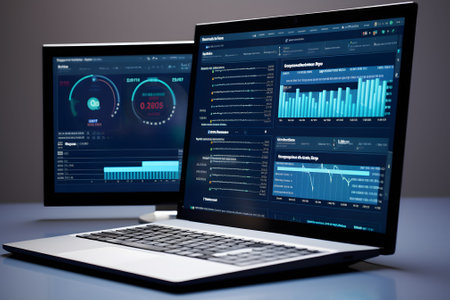
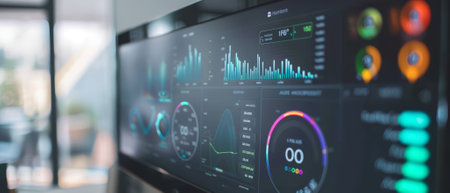
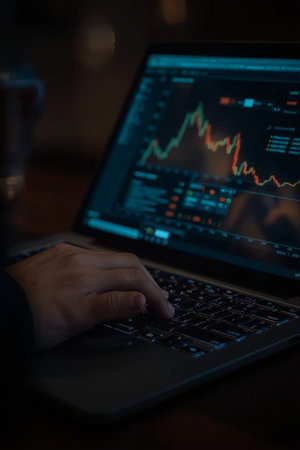
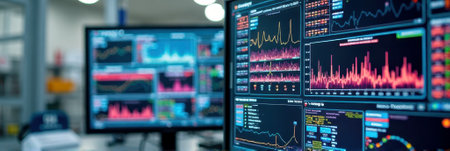
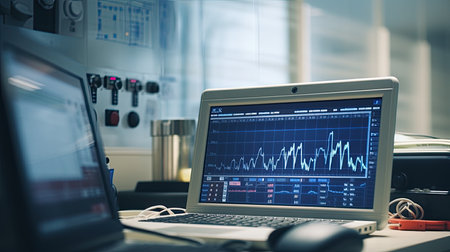
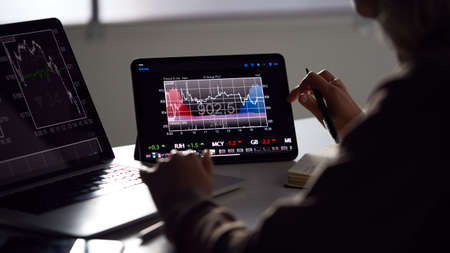
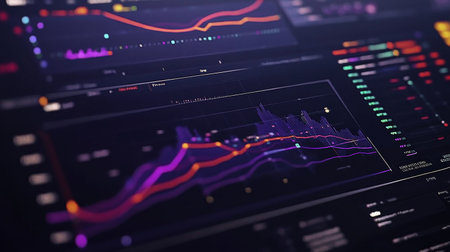
Laptop with the chart on screen. Business and finance concept
Коллекция по умолчанию
Коллекция по умолчанию
Создать новую

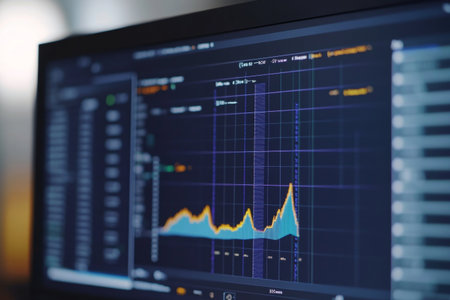
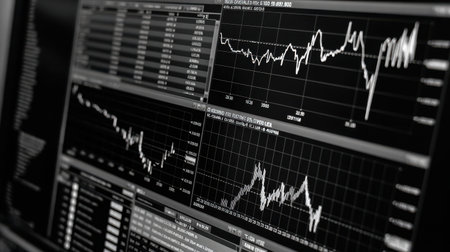
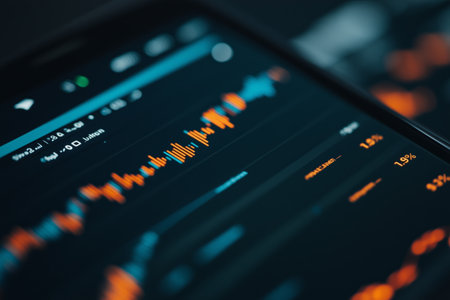
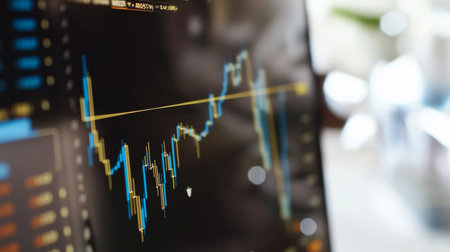
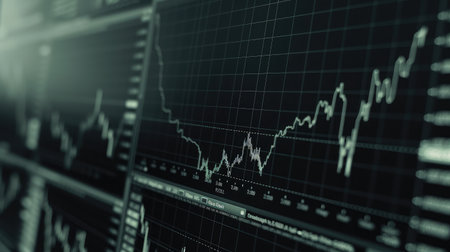
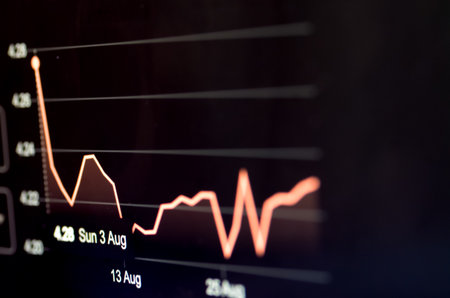
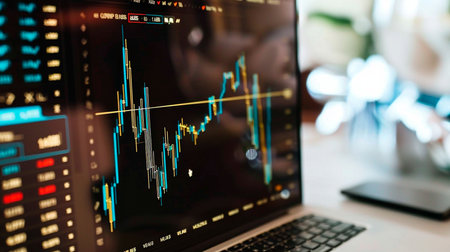
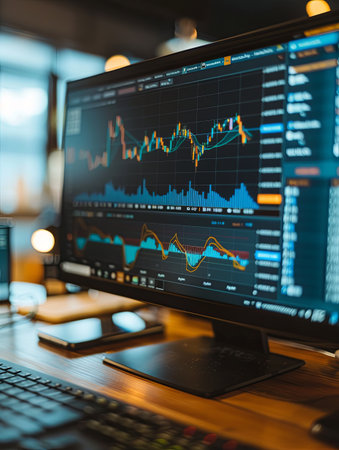
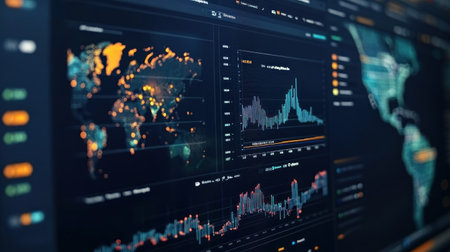
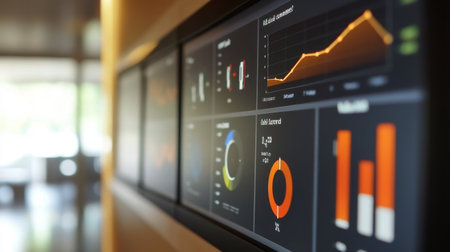
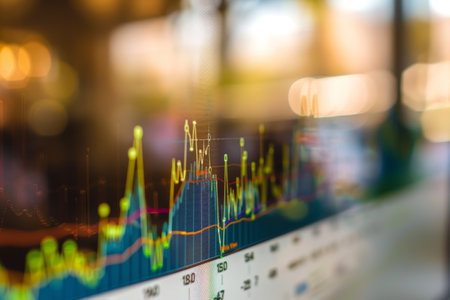
Shallow depth of field (selective focus) with details of a chart showing the stock market crash from March 2020 due to the Covid-19 pandemic on a computer screen (S&P500 index)
Коллекция по умолчанию
Коллекция по умолчанию
Создать новую

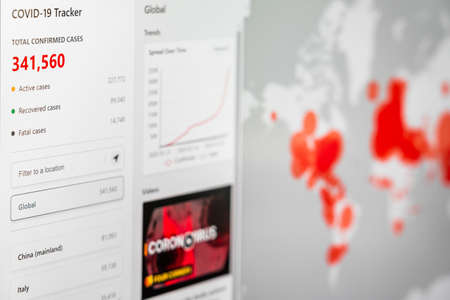
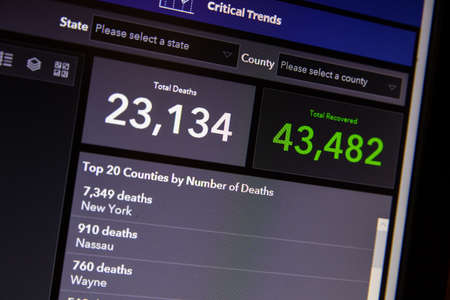
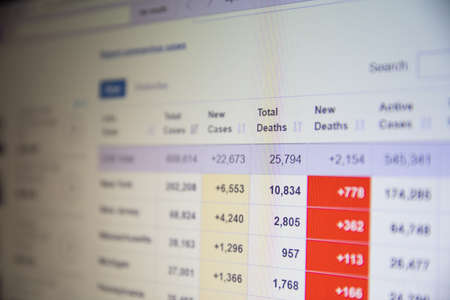
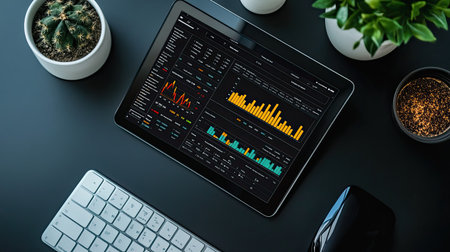
Person's hand holding mobile phone showing schedule of sick and recovered people infected with coronavirus. Breaking news on mobile phone highlighting total virus infected. World Pandemic 2020.
Коллекция по умолчанию
Коллекция по умолчанию
Создать новую
A close-up of a high-resolution computer screen reveals a detailed Python script focused on data cleaning and preprocessing techniques for data analysis.
Коллекция по умолчанию
Коллекция по умолчанию
Создать новую
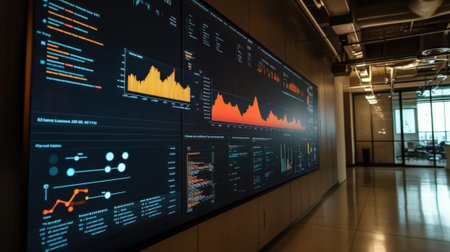
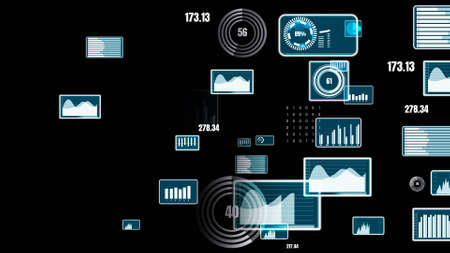
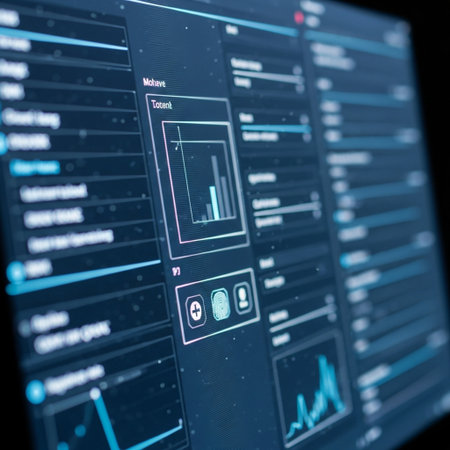
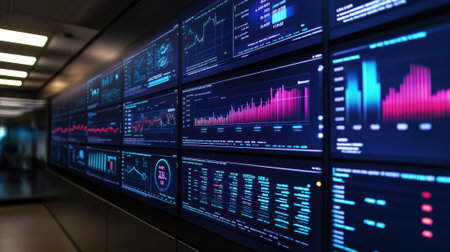
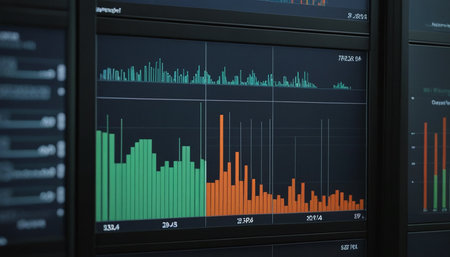
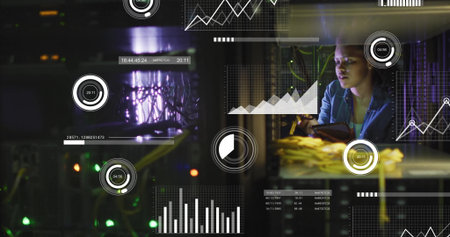
A focused shot of a large screen featuring realtime data visualization tools showcasing interactive segments filled with KPIs and metrics. The screen highlights areas of performanc
Коллекция по умолчанию
Коллекция по умолчанию
Создать новую

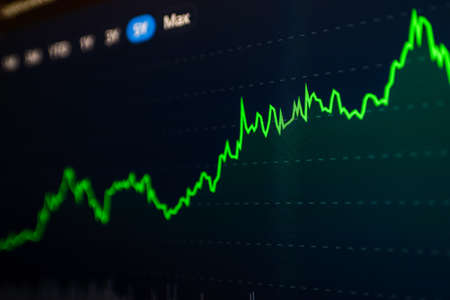
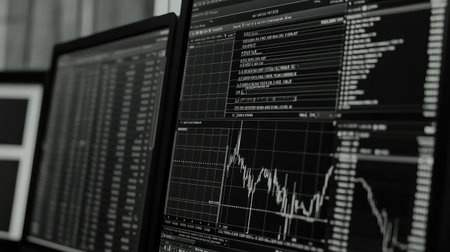
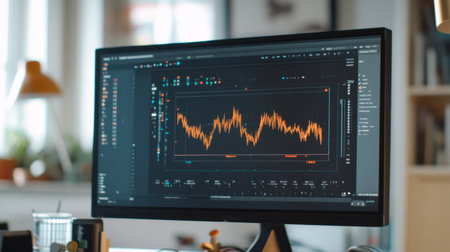
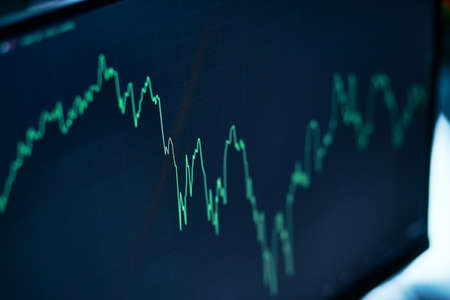
Stock market graph on screen. Ticker on monitor screen. Investing, Finance and Economic concept. Shallow depth of field.
Коллекция по умолчанию
Коллекция по умолчанию
Создать новую
Stock market data on monitor screen. Abstract stock market data background. Stock market data on monitor screen. Business financial graph on monitor. Stock market data on monitor.
Коллекция по умолчанию
Коллекция по умолчанию
Создать новую

A close-up of a digital dashboard with rising investments, offering space for adding content about investment performance, growth, or risk management
Коллекция по умолчанию
Коллекция по умолчанию
Создать новую
BUCHAREST, ROMANIA - MARCH 23, 2020: Coronavirus Total Cases Of The Pandemic Spreading All Around The Globe In March
Коллекция по умолчанию
Коллекция по умолчанию
Создать новую
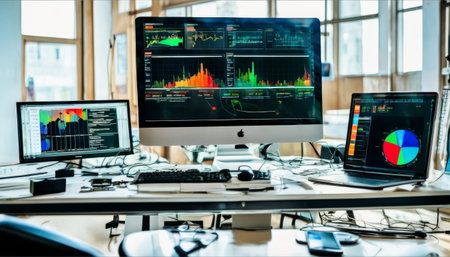
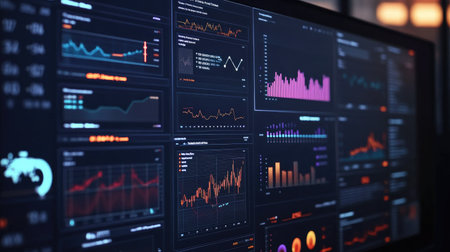
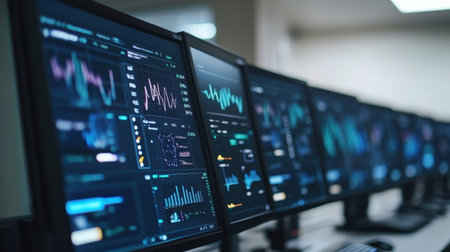
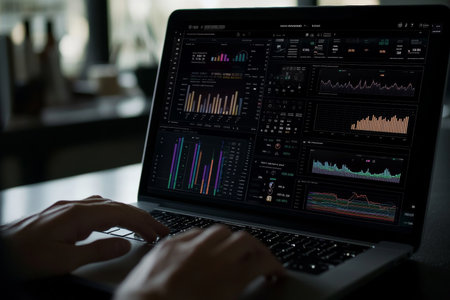
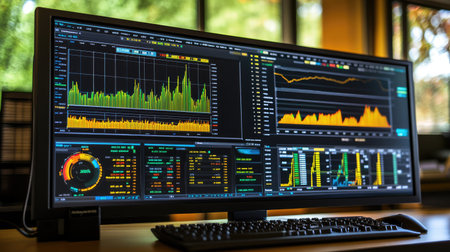
A detailed workspace with several monitors displaying financial data, graphs, and analysis tools in a well-lit office setting.. AI Generation
Коллекция по умолчанию
Коллекция по умолчанию
Создать новую

Bishkek, Kyrgyzstan - March 14, 2020: Discord voice communication app for remote work or study.
Коллекция по умолчанию
Коллекция по умолчанию
Создать новую
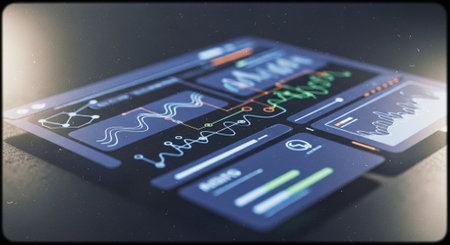
Visionary business dashboard for financial data analysis . 3D rendering computer graphic .
Коллекция по умолчанию
Коллекция по умолчанию
Создать новую
Stock market data on monitor. Financial graph on monitor. Stock market data on monitor. Stock market data on monitor. Business graph on monitor. Stock market data on monitor.
Коллекция по умолчанию
Коллекция по умолчанию
Создать новую
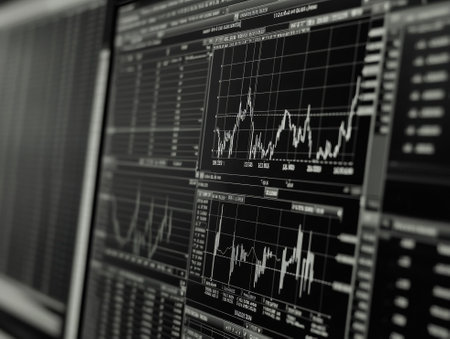
Black and white image of stock market charts showing price trends and fluctuations on digital display with financial data for analysis and review
Коллекция по умолчанию
Коллекция по умолчанию
Создать новую
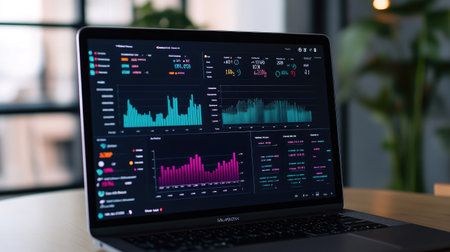
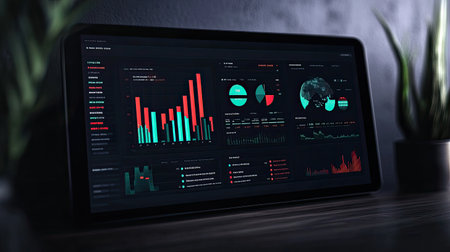
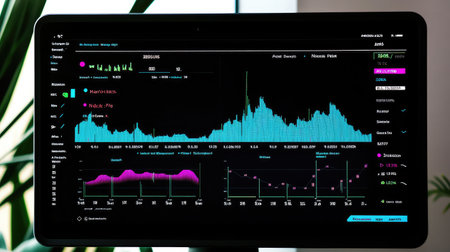
A close-up view of a digital dashboard showcasing various data visualizations. This image features colorful graphs and charts, ideal for illustrating analytics and performance insights in a modern workspace.
Коллекция по умолчанию
Коллекция по умолчанию
Создать новую
Close-up of a laptop screen with a dashboard displaying various graphs and charts, highlighting data visualization
Коллекция по умолчанию
Коллекция по умолчанию
Создать новую
NAMPA, IDAHO - APRIL 14, 2020: John hopkins tracks deaths vs recovery
Коллекция по умолчанию
Коллекция по умолчанию
Создать новую
Close-up of a laptop screen displaying a business analytics dashboard, with data and charts.
Коллекция по умолчанию
Коллекция по умолчанию
Создать новую
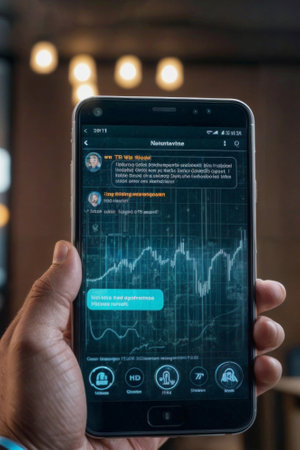
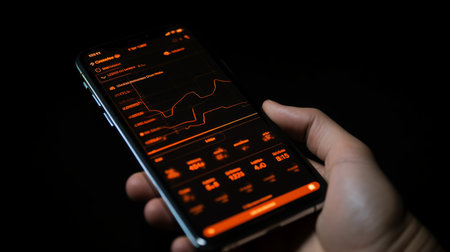
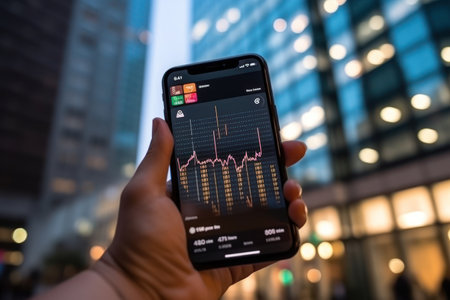
A businessman hand holding phone is looking at his smartphone screen with stock market data and chat interface, ideal for a mobile trading app concept
Коллекция по умолчанию
Коллекция по умолчанию
Создать новую
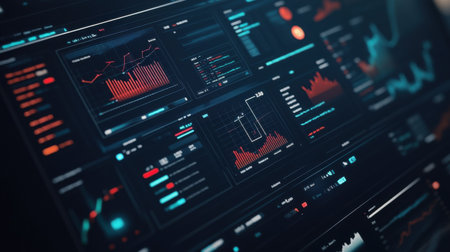
Dynamic representation of financial analytics on modern screens, highlighting various data metrics, perfect for illustrating technology and business concepts in a contemporary setting.
Коллекция по умолчанию
Коллекция по умолчанию
Создать новую
A detailed close-up of a laptop screen showcasing a data visualization graph in red tones, ideal for business, finance, and technology themes.
Коллекция по умолчанию
Коллекция по умолчанию
Создать новую
Screen with stock market index charts and diagrams - ai
Коллекция по умолчанию
Коллекция по умолчанию
Создать новую

image of the financial graph on a computer monitor.
Коллекция по умолчанию
Коллекция по умолчанию
Создать новую
Shopee data dashboard showcasing trend indicators, sales performance, and pie charts on a dark interface, with ample room for copy.
Коллекция по умолчанию
Коллекция по умолчанию
Создать новую
A collection of computer monitors showcases dynamic financial data and analytics. The vibrant graphs and dark themes create a modern workspace ideal for professionals.
Коллекция по умолчанию
Коллекция по умолчанию
Создать новую
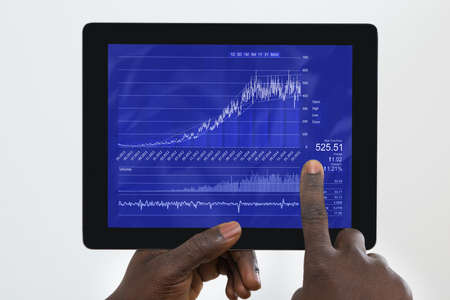
Close-up Of Person's Hand Holding Digital Tablet With Graph On Screen
Коллекция по умолчанию
Коллекция по умолчанию
Создать новую

Female doctor worked around the clock to save lives. Doctor cry and feel unhappy with covid-19 rapid spread and growing number of deaths. Nurse watching TV news about coronavirus. Exhausted doctor
Коллекция по умолчанию
Коллекция по умолчанию
Создать новую
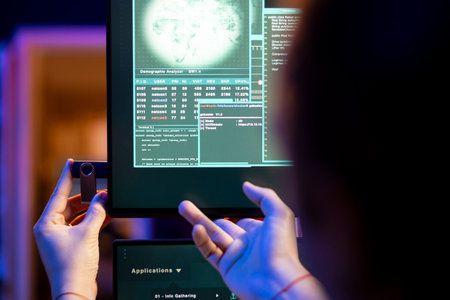
Close up of person using USB stick to extract information from secure digital systems. Person uploading USB flash drive on computer, running software
Коллекция по умолчанию
Коллекция по умолчанию
Создать новую
Analytics dashboard showcasing dynamic data trends on a smartphone screen during evening analysis session
Коллекция по умолчанию
Коллекция по умолчанию
Создать новую

image is a graph of financial development on a computer monitor.
Коллекция по умолчанию
Коллекция по умолчанию
Создать новую
Grow Stock market trading graph in graphic concept.financial investment or economic trends business design. Abstract finance background.Low angle shot.
Коллекция по умолчанию
Коллекция по умолчанию
Создать новую
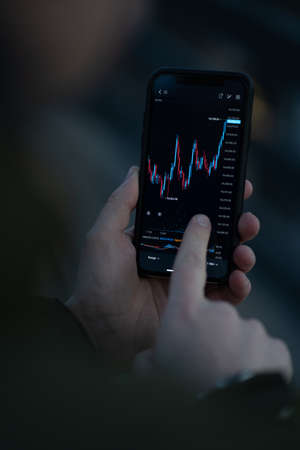
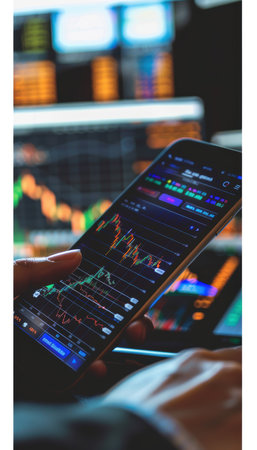
Trader checking stock market data in mobile app for trading online. Male hand touching smartphone screen with real time forex chart, reading financial news and analyzing price flow, selective focus
Коллекция по умолчанию
Коллекция по умолчанию
Создать новую
A modern workspace featuring multiple monitors showing analytical data and graphs, ideal for professionals in finance, technology, and research sectors focused on data analysis.
Коллекция по умолчанию
Коллекция по умолчанию
Создать новую
Financial data analyzing on monitor. Abstract financial data analysis on monitor.
Коллекция по умолчанию
Коллекция по умолчанию
Создать новую
Male executive using smartphone to conduct online mobile banking, investing in stocks and mutual funds, retirement investment ideas. High quality photo
Коллекция по умолчанию
Коллекция по умолчанию
Создать новую
Close-up view of laptop screen with graphs and charts on screen
Коллекция по умолчанию
Коллекция по умолчанию
Создать новую
A modern financial workspace with a computer showing market analysis charts, leaving space for copy about stock trading
Коллекция по умолчанию
Коллекция по умолчанию
Создать новую
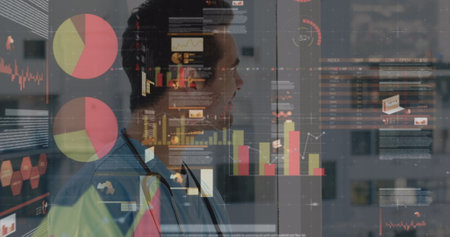
Image of statistics and data processing over male doctor. global medicine, healthcare services, digital interface and technology concept digitally generated image.
Коллекция по умолчанию
Коллекция по умолчанию
Создать новую
Close-up of a financial graph on a computer screen, showcasing upward and downward trends with detailed line and bar charts.
Коллекция по умолчанию
Коллекция по умолчанию
Создать новую
Close-up of a monitor with a stock market data on it.
Коллекция по умолчанию
Коллекция по умолчанию
Создать новую
Digital signal processing system with waveform analysis, filter settings, and output visualization on computer screen
Коллекция по умолчанию
Коллекция по умолчанию
Создать новую
Professional using laptop with virtual screens for financial analysis in modern office setting
Коллекция по умолчанию
Коллекция по умолчанию
Создать новую
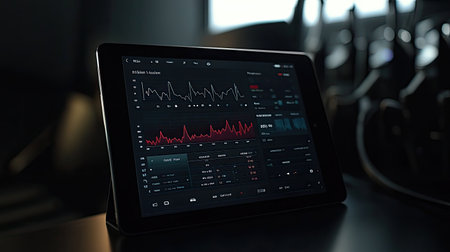
A tablet screen showing an interactive health tracking app with daily activity logs and progress reports, symbolizing digital solutions for health and fitness.
Коллекция по умолчанию
Коллекция по умолчанию
Создать новую
A close-up of a financial dashboard displaying stock price graphs, offering space for adding insights on stock analysis, price trends, or market shifts
Коллекция по умолчанию
Коллекция по умолчанию
Создать новую
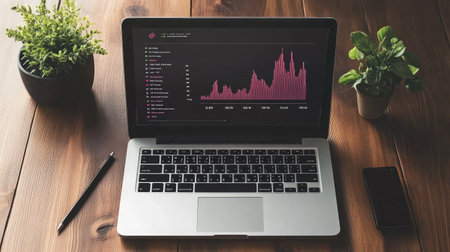
A stylish workspace featuring a laptop with a dynamic graph display, surrounded by green plants and a smartphone, perfect for illustrating business or technology themes.
Коллекция по умолчанию
Коллекция по умолчанию
Создать новую
Coronavirus pandemic statistics on screen. Number of Covid 19 cases rising. Map data showing increasing numbers of Corona virus pandemic infected cases. international statistics. Health care concept.
Коллекция по умолчанию
Коллекция по умолчанию
Создать новую
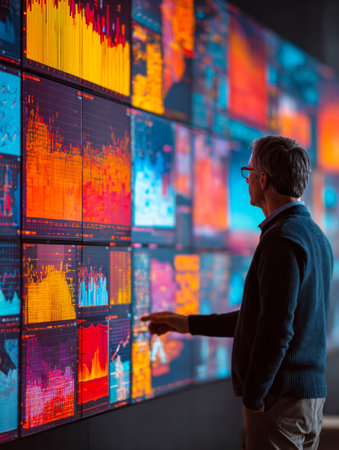
Big data analysis wall showing monitoring progress and financial analytics
Коллекция по умолчанию
Коллекция по умолчанию
Создать новую
A close-up of a smartphone screen showing a financial app with graphs tracking investment performance and market trends.
Коллекция по умолчанию
Коллекция по умолчанию
Создать новую
An interactive crowdfunding dashboard showcases real-time analytics, featuring detailed graphs and charts that track campaign performance metrics effectively. User engagement is highlighted.
Коллекция по умолчанию
Коллекция по умолчанию
Создать новую
A high-resolution image of a stock market graph on a computer screen.
Коллекция по умолчанию
Коллекция по умолчанию
Создать новую
graph of financial growth on a computer monitor.
Коллекция по умолчанию
Коллекция по умолчанию
Создать новую
Futuristic touch user interface. 3d rendering toned image
Коллекция по умолчанию
Коллекция по умолчанию
Создать новую
NAMPA, IDAHO - APRIL 14, 2020: Number of deaths as per worldometers website
Коллекция по умолчанию
Коллекция по умолчанию
Создать новую
Digital Finance: Analyzing Volatile Market Graphs and Managing Tiered Compensation Schedules on a Desktop.
Коллекция по умолчанию
Коллекция по умолчанию
Создать новую

An open laptop displays a bright dashboard UI in a dimly lit workspace, surrounded by softly glowing monitors, enhancing the modern tech atmosphere.
Коллекция по умолчанию
Коллекция по умолчанию
Создать новую
Smartphone and Tablet pc with financial charts and graphs on office desk, business concept
Коллекция по умолчанию
Коллекция по умолчанию
Создать новую
A computer monitor and keyboard are placed on a desk. Generative AI
Коллекция по умолчанию
Коллекция по умолчанию
Создать новую
desktop compucomputer with financial data graph
Коллекция по умолчанию
Коллекция по умолчанию
Создать новую
Stock market data on monitor. Finance and investment concept. 3d rendering
Коллекция по умолчанию
Коллекция по умолчанию
Создать новую
Investor's hand interacts with a stock trading app on a smartphone amidst a blurred office backdrop, emphasizing financial analysis and decision-making. the image highlights the convergence of technology and finance in a professional environment.
Коллекция по умолчанию
Коллекция по умолчанию
Создать новую
Workplace with a laptop and a cup of coffee on the table
Коллекция по умолчанию
Коллекция по умолчанию
Создать новую
A laptop computer placed on top of a wooden desk in a well-lit room. cybersecurity, double authentication, access code
Коллекция по умолчанию
Коллекция по умолчанию
Создать новую
A computer monitor displaying financial charts and graphs sits on top of a wooden desk. Generative AI
Коллекция по умолчанию
Коллекция по умолчанию
Создать новую
A closeup of a sophisticated digital screen filled with various data visualizations including predictive maintenance schedules and output forecasts showcasing a network of AI insights
Коллекция по умолчанию
Коллекция по умолчанию
Создать новую
Typing male in white shirt inputting data on silver laptop at office desk, with potted plant. Technological, productivity, professional, workspace, collaborative, modern, innovation
Коллекция по умолчанию
Коллекция по умолчанию
Создать новую
Global e-commerce dashboard displaying sales analytics, close-up of charts and graphs.
Коллекция по умолчанию
Коллекция по умолчанию
Создать новую
A detailed shot of a smart home dashboard monitoring energy and water usage, illustrating technology-driven sustainable living,
Коллекция по умолчанию
Коллекция по умолчанию
Создать новую
A focused professional observes colorful market data and trend graphs displayed on an advanced digital display, analyzing financial performance.
Коллекция по умолчанию
Коллекция по умолчанию
Создать новую
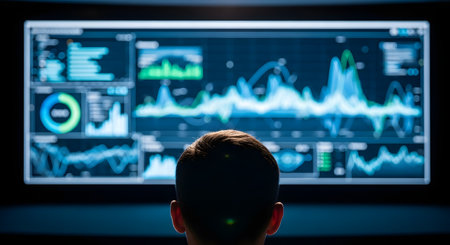
A view from behind of a data analyst or trader looking at a large, illuminated screen filled with a complex business intelligence dashboard. The screen displays various fluctuating graphs, charts, and data visualizations in real-time. This image symbolizes data science, financial analysis, stock trading, and modern technology.
Коллекция по умолчанию
Коллекция по умолчанию
Создать новую
Close-up of hands typing on a laptop displaying a complex dashboard with charts, graphs, and network diagrams. Represents data analytics and business intelligence. Ideal for fintech, tech, and productivity themes.
Коллекция по умолчанию
Коллекция по умолчанию
Создать новую
A computer screen displays a vibrant financial data chart with colorful lines and metrics. Ideal for illustrating modern business analysis and digital visualization.
Коллекция по умолчанию
Коллекция по умолчанию
Создать новую
Display of the professional video recorder with alarm Over signal. Too loud sound level
Коллекция по умолчанию
Коллекция по умолчанию
Создать новую
Close-up of a stock trading dashboard with multiple charts showing various stock performance metrics
Коллекция по умолчанию
Коллекция по умолчанию
Создать новую
Smart laptop screen display financial statistic graph or stock market chart. Dashboard show real time marketing business strategy graph represented increasing sales or trading money currency. AIG42.
Коллекция по умолчанию
Коллекция по умолчанию
Создать новую
Stock market analysts monitoring real-time data, charts, and graphs
Коллекция по умолчанию
Коллекция по умолчанию
Создать новую
A close-up of a computer monitor displaying a detailed business graph, with key metrics and indicators highlighted for analysis.
Коллекция по умолчанию
Коллекция по умолчанию
Создать новую
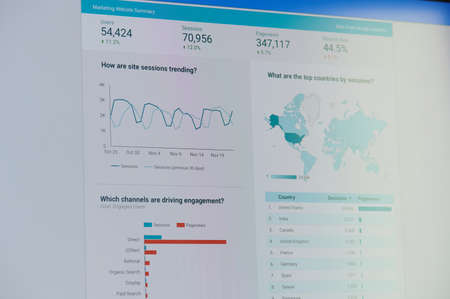
New york, USA - November 24, 2020: Google ads marketing website summarydashboard on laptop screen
Коллекция по умолчанию
Коллекция по умолчанию
Создать новую

Invest investor. Finance application for sell, buy and analysis profit dividend statistics. Investment business technology app on digital screen. Global currency background
Коллекция по умолчанию
Коллекция по умолчанию
Создать новую
Data analytics in modern finance: monitors displaying graphs and charts in a tech office. That the image is generated using AI.
Коллекция по умолчанию
Коллекция по умолчанию
Создать новую
A digital screen showing a financial report with market trend lines, providing room to add insights on stock evaluation, economic analysis, or market forecasting
Коллекция по умолчанию
Коллекция по умолчанию
Создать новую
High-tech setup with multiple screens displaying cryptocurrency and stock market data in a busy trading office.
Коллекция по умолчанию
Коллекция по умолчанию
Создать новую
A Line Graph Illustrates the Rewards of Long-Term Investment
Коллекция по умолчанию
Коллекция по умолчанию
Создать новую
Modern data visualization displayed on a large screen showcases graphs and charts reflecting financial performance metrics in a contemporary office setting.
Коллекция по умолчанию
Коллекция по умолчанию
Создать новую
A minimalist workspace with a sleek tablet showing a simple yet informative business graph and key data points.
Коллекция по умолчанию
Коллекция по умолчанию
Создать новую
Close-up of a stock trading dashboard with multiple charts showing various stock performance metrics
Коллекция по умолчанию
Коллекция по умолчанию
Создать новую
an ECG monitor in a hospital room, displaying a real-time heart rhythm of a patient, with medical professionals in the background ensuring the patient's well-being
Коллекция по умолчанию
Коллекция по умолчанию
Создать новую
IT technician scanning fiber optic cables using tablet in server room, with LEDs, copy space. Technology, connectivity, network, digital, infrastructure, futuristic, professional
Коллекция по умолчанию
Коллекция по умолчанию
Создать новую

Bishkek, Kyrgyzstan - March 14, 2020: Discord voice communication app for remote work or study.
Коллекция по умолчанию
Коллекция по умолчанию
Создать новую
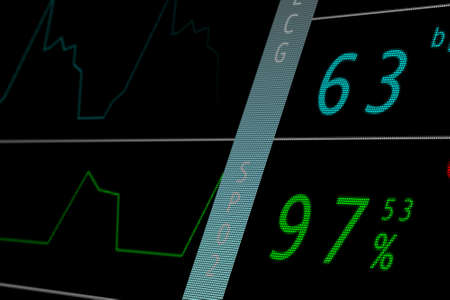
Heart Monitor ECG EKG
Коллекция по умолчанию
Коллекция по умолчанию
Создать новую
Dual monitors displaying dynamic financial data analysis in neon-lit workspace. That the image is generated using AI.
Коллекция по умолчанию
Коллекция по умолчанию
Создать новую
Close Up Of Female Share Trader At Desk With Stock Price Data Displayed On Laptop And Digital Tablet
Коллекция по умолчанию
Коллекция по умолчанию
Создать новую
Graphic of stock market financial indicator on smartphone screen in the city, Generative AI
Коллекция по умолчанию
Коллекция по умолчанию
Создать новую
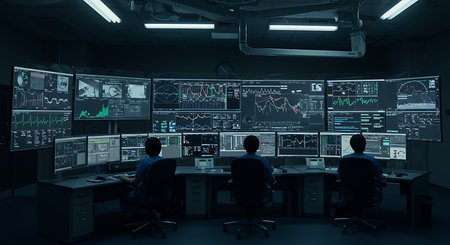
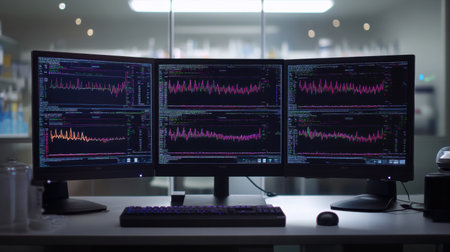
From behind, a team of three specialists in a dark, futuristic medical control room intently analyzes complex patient data displayed across a massive wall of glowing monitors.
Коллекция по умолчанию
Коллекция по умолчанию
Создать новую
Business statistics and Analytics value . Abstract glowing forex chart interface background. Investment, trade, stock, finance and analysis concept.
Коллекция по умолчанию
Коллекция по умолчанию
Создать новую
Stock Market Chart on Blue Background. share drop down and stock up
Коллекция по умолчанию
Коллекция по умолчанию
Создать новую
Stunning abstract data visualization featuring colorful graphs and charts. Ideal for illustrating statistics, analysis, or technology concepts in modern contexts.
Коллекция по умолчанию
Коллекция по умолчанию
Создать новую
Detailed view of a graph displayed on a digital screen, showing trend analysis for website traffic flow, Incorporate trend analysis for website traffic fluctuations
Коллекция по умолчанию
Коллекция по умолчанию
Создать новую
A computer screen displaying multiple financial reports, graphs and pie in corporate office background. beautiful Generative AI AIG32
Коллекция по умолчанию
Коллекция по умолчанию
Создать новую
Legion-Media
Создайте свои проекты на основе качественных стоковых фотографий и видео.


Copyright © Legion-Media.